Our Core Data Analysis Services
Transforming your data into actionable insights with our cutting-edge analytics solutions.
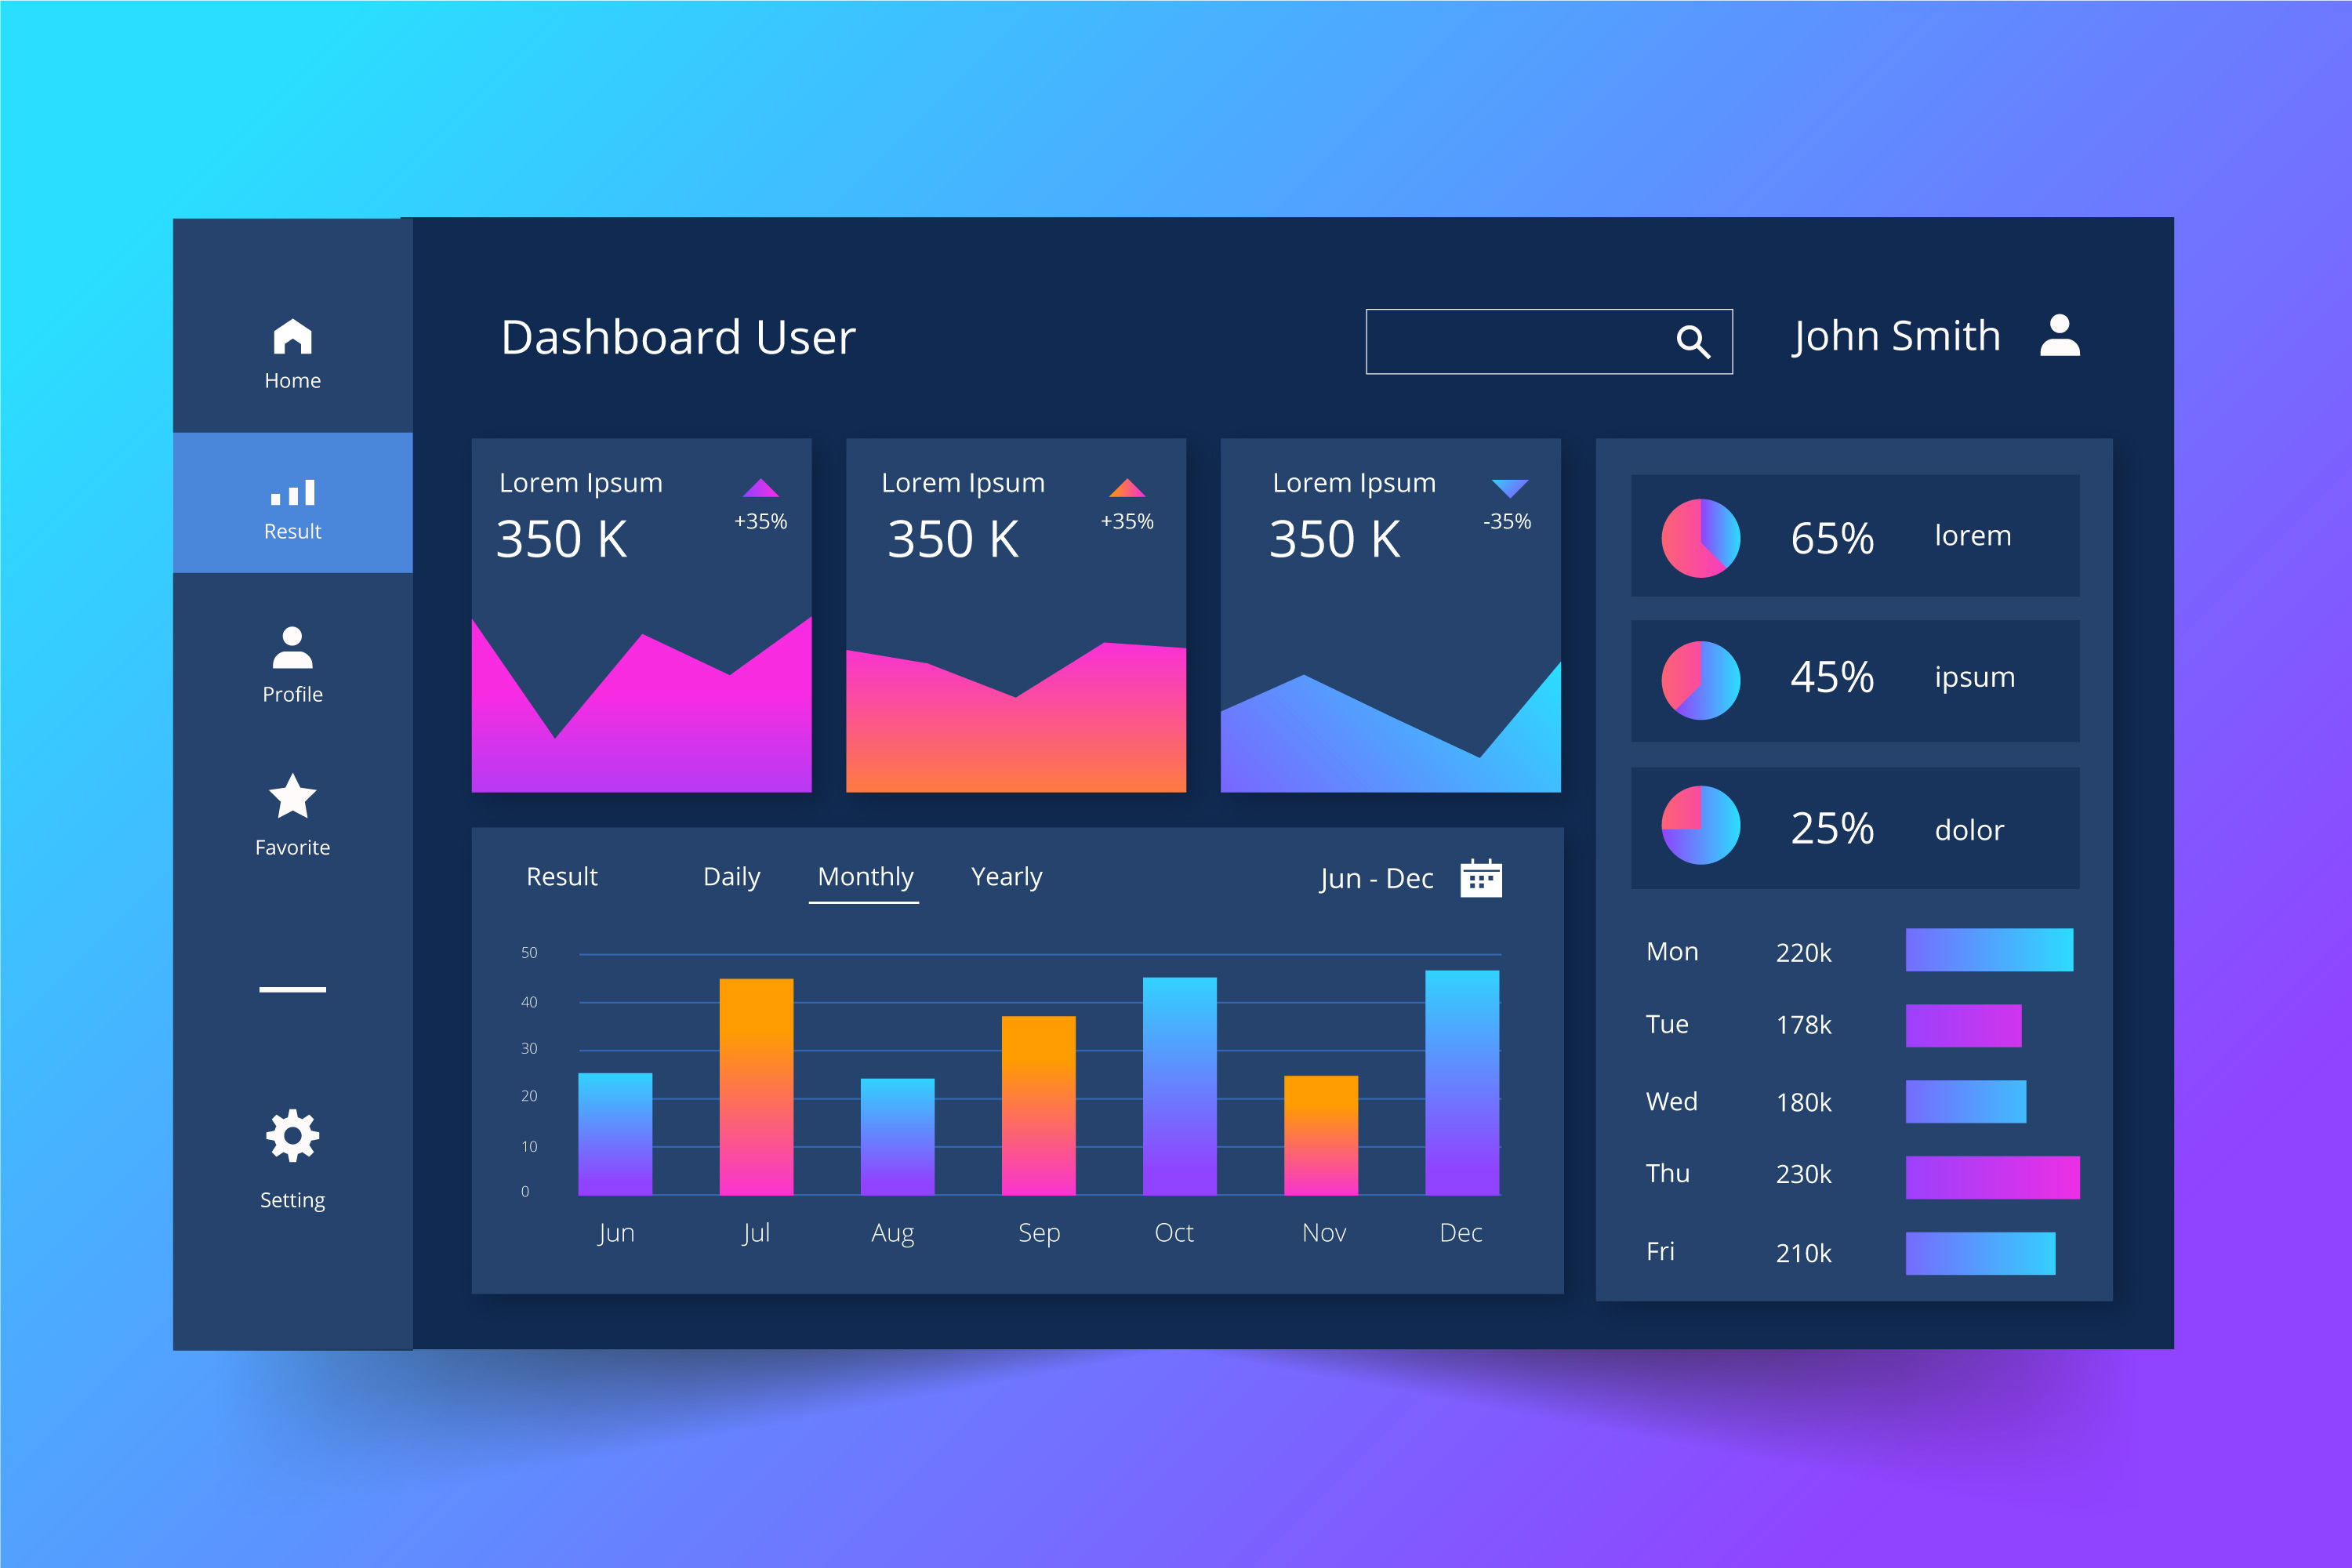
Power BI Dashboards
Interactive and real-time business intelligence dashboards that transform your data into visual insights for informed decision-making.
Advanced Excel Analytics
Unlock the full potential of Excel with sophisticated data models, formulas, and automation to streamline your financial analysis.
Tableau Visualizations
Create stunning, interactive data visualizations that tell your business story and reveal insights hidden in complex datasets.
Custom Dashboard Development with Python
Leverage the power of Python's data science ecosystem to create fully customized, interactive dashboards tailored to your specific business needs.
End-to-End Customization
Complete control over every aspect of your dashboard, from data processing to visualization design.
Advanced Analytics Integration
Incorporate machine learning models, statistical analysis, and predictive algorithms directly into your dashboards.
Scalable Architecture
Built to handle everything from small datasets to enterprise-scale big data solutions.
import pandas as pd
import plotly.express as px
import dash
from dash import dcc, html

# Load and process data
df = pd.read_csv('sales_data.csv')
df['month'] = pd.to_datetime(df['date']).dt.month

# Create visualizations
fig = px.line(
    df, x='month', y='revenue',
    color='region', line_dash='product',
    title='Monthly Revenue by Region'
)

# Build dashboard
app = dash.Dash(__name__)
app.layout = html.Div([
    html.H1('Sales Analytics Dashboard'),
    dcc.Graph(figure=fig),
    dcc.Dropdown(options=[...], ...)
])

if __name__ == '__main__':
    app.run_server(debug=True)
Our Python Dashboard Development Process
From requirements gathering to deployment, our structured approach ensures your custom dashboard delivers maximum business value.
Requirements Analysis
We work closely with your team to understand your data sources, KPIs, and dashboard objectives to create detailed specifications.
Data Engineering & Preprocessing
Our data engineers clean, transform, and structure your data to create a robust foundation for your dashboard.
Dashboard Design & Prototyping
We create wireframes and interactive prototypes to visualize the dashboard layout, components, and user interactions.
Development & Testing
Our Python specialists develop the dashboard using best practices, with rigorous testing for functionality and performance.
Deployment & Integration
We deploy your dashboard to your preferred environment and integrate it with your existing systems and data sources.
Popular Use Cases
Our Python dashboards are being used across industries to solve complex data visualization challenges.
Financial Analytics
Real-time monitoring of financial KPIs, cash flow analysis, budget tracking, and investment performance visualization.
Sales & Marketing
Campaign performance tracking, customer segmentation analysis, sales funnel visualization, and ROI measurement.
Operations Management
Supply chain monitoring, inventory management, production efficiency tracking, and process optimization.
Specialized Data Analysis Services
Advanced analytics solutions powered by cutting-edge technology to transform your data into strategic business advantages and actionable insights.
Cloud-Based Analytics
Seamlessly integrate your data with cloud platforms for efficient, scalable, and collaborative analytics solutions.
Cloud-Based Analytics
- Real-time data processing
- Scalable storage solutions
- Multi-user collaboration
- Automated backups and recovery
- Integration with AWS, Azure & GCP
Predictive Analytics
Utilize machine learning and statistical models to predict future trends and outcomes, empowering data-driven business decisions.
Predictive Analytics
- Time series forecasting
- Customer churn prediction
- Risk assessment models
- Demand forecasting
- Anomaly detection systems
Advanced Business Intelligence
Unlock powerful insights from your business data with advanced BI tools and techniques to identify patterns and optimize processes.
Advanced Business Intelligence
- Interactive executive dashboards
- KPI monitoring systems
- Automated reporting workflows
- Data discovery tools
- Cross-platform data integration
Data Integration & ETL
Connect and transform data from multiple sources into a unified format ready for analysis and decision-making.
Data Integration & ETL
- Custom ETL pipeline development
- Data warehouse implementation
- API integration services
- Data quality assurance
- Scheduled data processing
Data Visualization
Transform complex data into compelling visual stories that reveal patterns, trends, and insights at a glance.
Data Visualization
- Interactive data dashboards
- Advanced charting techniques
- Geospatial mapping
- Real-time data visualization
- Custom visualization development
Big Data Analytics
Process and analyze massive datasets using advanced technologies to uncover hidden patterns and valuable business insights.
Big Data Analytics
- Hadoop/Spark implementation
- Stream processing
- Data lake architecture
- NoSQL database integration
- Distributed computing solutions